Warmest night in The Netherlands so far. Extreme summer temperatures are rising - an update
July 27, 2018

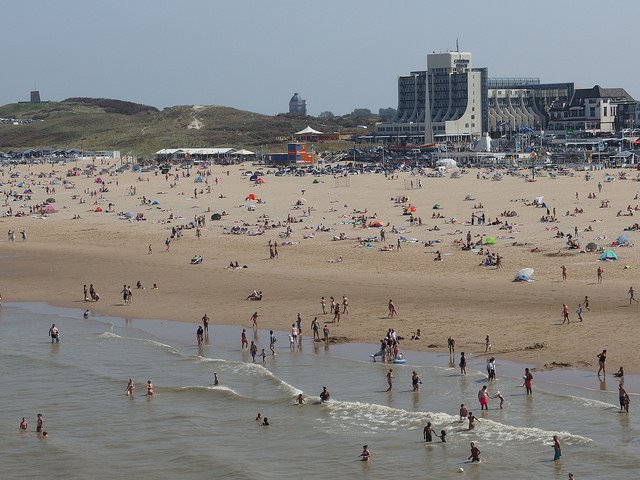
Looking for cooling in the North Sea (photo: Guilhem Vellut, www.flickr.com)
It’s Friday 27 July. Most of the Dutch will feel quite tired today since they haven’t slept. It was too hot. Last night was the warmest night ever measured in The Netherlands. The previous record of 2004, a minimum night temperature of 20.8°C, was exceeded by a landslide. Temperature at the ‘official’ registration spot for national weather records, the location of the Royal Netherlands Meteorological Institute, did not drop below 23.6°C. It wasn’t the only record in The Netherlands this week: the drought of this year’s summer and spring is the most severe ever measured. The record drought of 1976 has been defeated.
No doubt, these extremes will boost discussions on how to adapt to climate change. Cities are the most vulnerable hot spots for tropical nights in a temperate climate. How can cities ‘beat the heat’? We’ve published the summary below last year on the ClimateChangePost. Stay informed on heat-related health impacts of climate change and check out the articles in our health section.
Urban heat island
Cities are generally warmer than their surrounding area, because of the heat that is produced in the city and trapped in concrete and asphalt. This is the urban heat island effect: the temperature difference between the city and the surrounding rural area.
For London an urban heat island effect was calculated of 2.0°C for minimum temperature in summer and of 1.1°C for minimum temperature in winter. For Glasgow in 2011 an urban heat island effect was measured of around 3°C in spring and summer. During prolonged periods of hot, dry weather, the intensity of the urban heat island can build up night after night, however. The urban heat island effect is most pronounced during calm nights with clear skies. In these situations this effect at night can be up to 7°C (for Rotterdam) or even 10.5°C (Hamburg). During the heat wave of 2003, the centre of London was up to 10°C warmer than the surrounding greenbelt, and there were over 2,100 excess deaths in England and Wales, with those worst affected being over the age of 75. The impact was greatest in the London region.
Open water dampens the diurnal cycle: in summer, the suburbs close to the inner-city water bodies experience advective cooling during the day and warming at night. The advection of warm air from adjacent water bodies at night may enhance the urban heat island effect. Water bodies within built-up areas hinder cooling at night especially in summer when cooling is most needed.
Urban heat island effect amplified by heatwaves
The urban heat island effect is highest during the nighttime and early morning (prior to sunrise) hours: for New York City a difference between urban and rural temperature at night as high as 8°C was observed during a heat wave in 2016. During daytime, however, urban and rural temperatures were more or less the same. This clearly illustrates that cities stay hot during the night due to increased thermal storage. The built surfaces that dominate the urban environment have high thermal inertia and hence have high heat storage capacity.
The observations in New York also illustrate that heat waves amplify the heat island effect: the urban-rural temperature difference at night may be up to 3°C higher during heat wave days compared to regular days. This is due to the fact that the high-pressure weather system during a heat wave inhibits the heat of the city to be transferred to the upper atmosphere. Thus, the heat stays close to the surface thereby amplifying the near surface air temperature. In addition, the soil in the city dries out during a heat wave. Higher surface soil moisture means more evapotranspiration to cool the urban environment. The high soil desiccation during a heat wave, however, limits this moderating impact of evapotranspiration.
Thus, heat waves may amplify the urban heat island effect. The frequence, duration and intensity of heat waves will increase due to global warming. Thus, the urban heat island effect may become stronger in the future.
More people dying in hot cities
As a result of cities getting ever hotter in the summer, more people may die. The annual heat-related death rates in Lisbon, for instance, may increase from between 5.4 and 6 per 100,000 in 1980-1998 to between 8.5 and 12.1 by the 2020s, and to a maximum of 29.5 by the 2050s, if cities do not take adequate measures to adapt. The expected increase in the number of elderly and other potentially vulnerable groups, in absolute numbers and as a proportion of the population, could make the impact of temperature extremes on human health even more severe.
According to model results of (intermediate) climate change for London, the urban heat island effect hardly changes between now and 2050: the projected change is less than 0.1°C. In absolute terms cities will be hotter though: the heat island is operating within a warmer climate. According to an estimate there may be an additional 600 heat related deaths per year in Greater London by the 2050s, under a high-end scenario of climate change. The vulnerability of London to high temperatures is high, as London has a large and increasing elderly population, and a high number of people living in poor quality and over-crowded homes. A significant proportion of London’s development and infrastructure is not designed for hot weather.
How cities can beat the heat
What measures may be effective in reducing the urban heat island effect and cool down cities during heat waves? Measures can be taken with respect to both buildings and public space.
Suitable adaptation measures for existing buildings are insulation, cooling systems, sunscreens, blinds and shutters, increased reflecting levels of roofs (albedo), and green roofs. New buildings can be designed such that the exposure to the sun is limited. Relying on energy-intensive technologies such as air conditioning is not sustainable and can be considered maladaptive.
At the level of streets, quarters or entire cities several measures can be taken as well: more open water, fountains, vegetation (cooling due to evaporation), high albedo pavement instead of asphalt, creating optimal shading in building orientation, compact building and (big leaf) trees, orientation and profile of streets regarding wind direction (affecting wind speed and urban ventilation). In order to combat overheating of London, the city council intends to plant two million trees and lay out ‘pocket parks’ in the inner city. This will result in an increase of green area by 5% in the next 20 years. Plans are to increase London’s green area by one third before 2050.
The cooling potential of blue and green infrastructure to reduce the urban heat island effect has been assessed for Vienna, the capital of Austria. In Vienna, a warming trend has been observed between 1961 and 2010. A model simulation for Vienna with green infrastructure shows that a substantial reduction in temperature is achieved only by incorporating an extensive amount of vegetation. Heat load mitigation measures should be applied extensively in order to reach substantial reduction in urban heat load on a city scale. With the application of several heat load mitigation measures such as decrease in building density by 10% and pavement by 20%, enlargement in green and water spaces by 20%, it is possible to achieve a substantial cooling effect. A relatively small change in infrastructure may reduce the annual number of summer days with a maximum temperature ≥ 25°C by 10 or more.
A comparison of recent insights from scientific studies on often-advocated measures such as green roofs, planting more trees, and increasing the albedo of roofs and pavements, showed that green roofs (such as a mat of sedum) on cooling the city might not be that effective. Observations of green roofs in Chicago, for instance, did not alter temperatures in the surrounding areas significantly. A modeling study simulating 25% of the roof area along a street in the centre of Arnhem in the Netherlands as green roofs had no effect on street-level temperatures for conditions such as the 2003 European heat wave: the wind blew away the cooler air before it could reach the ground. Instead, whitening roads and roofs (cool roofs), and thus increasing the city’s reflectivity or albedo, planting trees and converting paved areas to grass seem to be more effective.
National Heat Plans for silent disasters
For many cities, adaptation of buildings and public space may not suffice. In addition, heat plans are needed. National Heat Plans are now being applied throughout Europe. These plans aim to minimize the effects of high temperatures on health through a warning and adequate response system, to define guidelines for intervention, and to strengthen cross-institutional coordination. As an example, the Portuguese plan distinguishes four warning levels: (1). Blue: surveillance; (2) Yellow: effects on health foreseen; (3) Orange: heat wave, severe consequences foreseen relating to health and mortality; (4) Red: acute heat wave, very severe consequences foreseen relating to health and mortality.
The European Network of Meteorological Services has created Meteoalarm as a way to coordinate warnings and to differentiate them across regions. One should be aware, though, that heat waves are silent disasters. In Portugal the surveillance partners had difficulties in conveying out messages to the population, using the media, late in the heat stress period of 2003. It was concluded that active ways must be sought to convey information to the population, when such a silent disaster is predicted. Passive systems, such as using the media to spread messages of interest during heat stress periods, are not reliable especially in a very long heat wave. Citizens are often unaware of their risk and heat wave warning systems go largely unheeded.


