The warmer Europe gets, the more precipitation, runoff and river discharge change
September 4, 2017

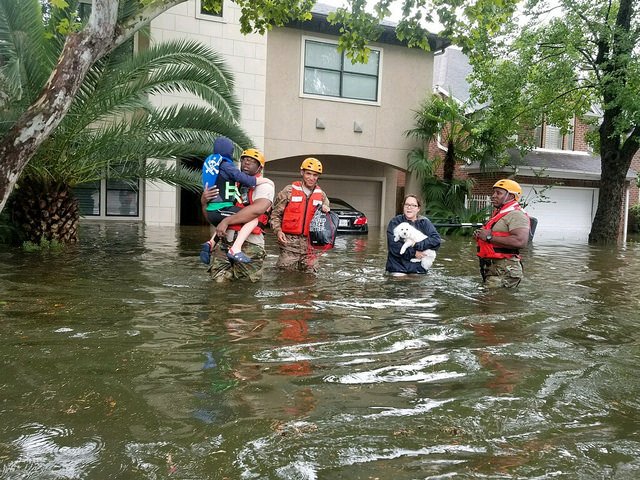
The extremely heavy rainfall in Houston due to Hurricane Harvey may be (partly) due to a warmer climate (photo: Texas Military Department, www.flickr.com)
In a warmer world, hydrological impacts of climate change are more intense. Heavy rainfall becomes more heavy, highest river flows further increase and lowest flows decrease. In addition, these changes affect wider areas. Impacts of climate change at 1.5, 2 and 3 °C mean global warming above preindustrial level have been assessed and compared for precipitation, snowpack, runoff, and discharge in Europe. This was done by using the results of a number of climate models as input for hydrological models. The hydrological impacts in a warmer Europe were compared with the situation in the period 1971-2000 as a reference.
Precipitation
Generally, changes in precipitation and evapotranspiration are higher for higher levels of global warming. Where precipitation is projected to decrease with increased warming, these decreases become larger, where precipitation is projected to increase, it increases more.
Regionally, there are robust increases in total annual precipitation in most of central, western and northern Europe, for all levels of warming. The decreases in precipitation projected around the Iberian coast become larger and more widespread with increasing warming. Changes in precipitation are negligible or uncertain in the rest of southern Europe and in the UK.
As expected, the snowpack decreases in most parts of Europe.
Evapotranspiration
At 3 °C warming mean annual evapotranspiration is clearly higher and changes are more robust than at 1.5 °C in most of Europe except the south. Evapotranspiration is projected to decrease on the Iberian Peninsula because there is simply not enough moisture available to increase actual evapotranspiration due to the decreases in precipitation.
Runoff
Mean annual runoff is indicative of available water resources for agriculture, water supply, navigation, etc. Mean annual maximum runoff is indicative of recurring high flows, and mean annual low runoff is indicative of dry conditions.
In parts of Europe where runoff is affected by climate change, there is a distinct increase in the changes to mean, low and high runoff at 2 °C compared to 1.5 °C. Between 2 and 3 °C, the changes in low and high runoff levels continue to increase, but the changes to mean runoff are less clear.
For all levels of warming, the changes to runoff are strongest in winter with large increases in runoff seen in Scandinavia and the Alpine regions. Robust increases in runoff affect the Scandinavian mountains at 1.5 °C, and extend over most of Norway, Sweden and northern Poland at 3 °C. Decreases in mean annual runoff are seen only in Portugal at 1.5 °C warming, but at 3 °C warming, decreases to runoff are seen around the entire Iberian coast, the Balkan Coast and parts of the French coast.
Discharge Europe’s largest rivers
As a result of the increase in mean runoff for large parts of northern Europe, annual mean discharge of rivers in this area increase as warming level increases. In a similar way, decreases in river discharge with increasing warming level are consistent with runoff decreases in southern Europe.
In other parts of Europe changes in mean annual discharge are less clear. This was illustrated for the rivers Rhine and Danube, and points at contrasting changes in winter to summer: in winter, discharges increase due to higher winter precipitation and earlier snowmelt, while summer discharge decreases due to lower snowmelt runoff from the Alps and increased evapotranspiration.
The need to mitigate global warming to 1.5 °C
According to the authors of this study, their results indicate that it does make a difference on water impacts in Europe if we can mitigate global warming to 1.5 °C. Given the current emissions trajectory beyond a +3 °C warming, substantial emissions reductions will be required to avoid severe impacts on the water cycle in Europe.
Source: Donnelly et al., 2017. Climatic Change 143: 13-26


