Transport, infrastructure and building
Navigation conditions on the Rhine-Main-Danube corridor under climate change
May 21, 2013
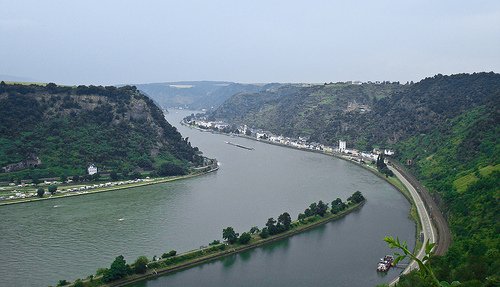
The impact of hydrological changes on navigation conditions has been studied for the Rhine-Main-Danube corridor, one of the most important waterways in Europe, for a number of climate change projections. Four impacts were studied: low flow, floods, ice and visibility (fog). The results are summarized in the table below.
Table: Summary of (projected) effects of climate and hydrological change on navigation on the Rhine-Main-Danube corridor. The findings marked by * were not directly observed or modelled but concluded from other findings (e.g. approximate indicators, neighbouring regions or from literature).
Phenomenon
Period
Middle Rhine
RMD canal
Upper Danube
Low flow
1950-2005
Positive effect
No effect*
Positive effect
Middle 21st century
No effect
Unknown
Negative effect*
End 21st century
Negative effect
Negative effect*
Negative effect*
High flow
1950-2005
No effect
No effect
No effect
Middle 21st century
Negative effect
No effect*
No effect*
End 21st century
Negative effect
No effect*
Unknown
River ice
1950-2005
Positive effect
Positive effect
Positive effect
Middle 21st century
No effect*
Positive effect*
Positive effect*
End 21st century
No effect*
Positive effect*
Positive effect*
Visibility (fog)
1950-2005
Positive effect
Positive effect
Positive effect
Middle 21st century
Unknown
Unknown
Unknown
End 21st century
Unknown
Unknown
Unknown
Low-flow threshold
In this study, the low water threshold for navigation has been defined as the 95th percentile of the flow-duration curve for the period 1961-1990. For the River Rhine this threshold is currently (1961-1990) undershot on about 18 days per year. For the River Danube, where only monthly discharge data are available, this threshold is interpreted as the number of months the monthly 95th percentile is undershot in a 30-year period (at the gauge Vienna).
- Past: Since the 1970s the number of days with discharge lower than the low-flow threshold has decreased at the Rhine gauges Kaub and Ruhrort. Beginning in the early 1990s there was a decade with only a few days below this threshold. The year 2003 was the first year of a period when longer low flow situations re-occurred. At the gauges on the River Danube similar tendencies were observed during the 20th century as on the River Rhine.
- Future: For the near future (up to 2021-2050) all discharge projections for the Rhine except one show that the number of days below the low-flow threshold for 1961-1990 will remain in the range that has been observed since the 1950s at gauge Kaub. For the distant future (2071-2100) some projections still show a reduced number of days below this threshold, while a majority of the projections shows a higher than present number of days below this threshold. These projections show a continuation of the shift of the low-flow season from winter to summer, which has already been observed in the last decades. The low-flow situations tend to become more extreme (in terms of intensity and duration) at the end of the 21st century. For the Danube (at gauge Vienna) the majority of the projections for the near future (2021-2050) shows a moderate increase in the number of months below this low-flow threshold, whereas the distant future (2071-2100) shows that the present low-flow threshold will be undershot more frequently. The shift of the low-flow season from winter towards summer is simulated to occur in the distant future (not in the near future).
Floods
At high water levels, navigation may be restricted in terms of speed limits, the concentration of traffic in the centre of the fairway (to reduce wave stress on the lateral infrastructure) and (at the highest threshold) a general stoppage of navigation. In this study the flood threshold for the River Rhine was defined as a discharge that is exceeded on 3% of the days per year in the mean of the period 1961-1990. For the River Danube this definition could not be applied because only monthly discharge data were available.
- Past: For both the Rhine and the Danube, neither a trend nor a tendency is obvious from the data at the studied gauges.
- Future: For the near future (up to 2021-2050), most of the projections for the Rhine point towards a higher number of days than at present when navigation is restricted due to floods. Most projections are clustered in a range between 11 and 20 days per year. For the distant future (2071-2100), the span of results is much wider; also here, a majority of the projections shows more days above the threshold, ranging between 8 and more than 30 days per year. For the Upper Danube no clear picture can be given yet of the future development in the number of days with restricted navigation due to high flow.
River ice
With respect to the Rhine-Main-Danube corridor, ice is mainly an issue for the River Main, the RMD canal and the River Danube.
- Past: Since 1950 the number of days with stoppage of navigation due to river ice has decreased.
- Future: The number of days with stoppage of navigation due to river ice will continue to decrease. The projected reduction towards ever less restrictions for navigation due to river ice is particularly pronounced in the last decades of the 21st century.
Visibility
Meteorological phenomena can reduce visibility and thus can harm vessels that navigate on sight. Vessels without radar systems can be stopped according to official regulations. But also vehicles with radar have to operate with care, which often means loss of time due to speed limits and slower manoeuvring.
- Past: A distinct reduction of the number of days per year with low visibility has been observed at all stations in the 1970s. This may be the result of a strong decline of aerosol emissions over Europe.
- Future: Due to current limitations of the regional climate models it is not possible to directly conclude on the number of days with fog occurrence for future time horizons. Besides, also non-climatic factors (such as effects of urbanisation) control fog formation.
Source: Nilson et al., 2012. ECCONET Report for the European Commission.
Photo: Abhishek Srivastava (www.flickr.com)

