Coastal erosion and coastal floods
Rate of sea level rise is accelerating, as predicted
February 16, 2018

Amsterdam (the Netherlands) has the world’s longest time series of sea level rise. Measurements started in 1700 at the City’s Water Office (Stadswaterkantoor), the building in the middle of this drawing.
Satellite data versus tide gauges
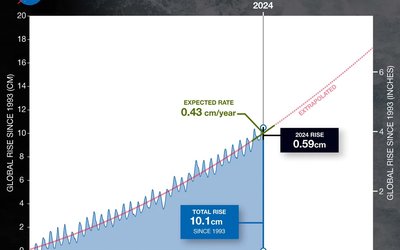
Since 1993 global mean sea level is measured by satellites. These satellite altimeter data are far more accurate in monitoring global mean sea level rise than tide gauges since the latter, naturally, only cover a relatively small part of the earth’s ocean. Unlike tide-gauge data, satellites sample the open ocean and allow for precise quantitative statements regarding global sea level.
Tide gauge data show that global mean sea level has been rising at a rate of 1.1 ± 0.3 mm/year in 1901-1990. Satellite data show a sea level rise of 3.1 ± 1.4 mm/year over 1993-2012. Clearly, the rate of global mean sea level rise is accelerating. This is no surprise; scientists have projected this for many years. We just needed a sufficiently long dataset of accurate measurements to find the signal. Now that satellite data span a time period of 25 years, several studies are carried out to quantify this acceleration. Here we summarize some recent results.
Climate-change–driven acceleration of sea level rise
A preliminary satellite-based estimate of the climate-change–driven acceleration of sea level rise was obtained by Nerem et al. (2018), based on the entire 25 years time series of satellite altimeter data. They found an average climate-change–driven rate of sea level rise of 2.9 mm/year. The acceleration of sea level rise in this time period would lead to 65 ± 12 cm global mean sea level rise by 2100 compared with 2005, they concluded. This roughly agrees with the latest projections of the IPCC under a high-end scenario of climate change. Thus, the observed acceleration would more than double the amount of sea level rise by 2100 compared with the current rate of sea level rise continuing unchanged. Again, this is no surprise; the acceleration has always been part of the future projections of the impacts of climate change.
Main driver: thermal expansion of the oceans
Yi et al (2017) studied the same satellite data, be it over a shorter time period of 2005-2015, but combined these data with observations of changing salinity and temperature in the oceans, and of land water and land ice contributions to global mean sea level rise. Thus, they were able to ‘scrutinize and understand the sources of the sea level acceleration in the last decade’. According to their results, the acceleration during the last decade is about 3 times faster than its value during 1993-2014. The acceleration comes from three factors, they conclude: a declining amount of water that is stored on land (~41%), land ice melting (~15%), and thermal expansion of the water of the oceans that are warming up (~44%). The first factor refers to, among other, fast amounts of groundwater that have been extracted and in the end reach the oceans. The contribution of the thermal expansion of the oceans to the acceleration of sea level rise is about three times as large as the contribution of melting land ice.
Recent results agree with previous studies
The conclusion that the rate of global sea level rise is increasing agrees with the results of previous studies. In one of these studies a significant acceleration of sea level rise was identified from 2.67 ± 0.19 mm/year in 1993-2004 to 3.49 ± 0.14 mm/year in 2004-2015 (Dieng et al., 2017). In another, a gradual increase of the rate of sea level rise over the period 1993-2014 was quantified from 2.2 ± 0.3 mm/year in 1993 to 3.3 ± 0.3 mm/year in 2014 (Chen et al., 2017).
A lower bound estimate of sea level rise?
Of course, the datasets used in these studies are relatively short. Natural variabilities easily disturb the signals of climate-change–driven acceleration of sea-level rise over such a short time step. Still, they give a first impression of an observed acceleration that agrees with previous model projections. Besides, they shed light on the underlying mechanisms of sea level rise acceleration and reflect its susceptibility to global warming. In fact, the estimated 65 cm global mean sea level rise by 2100 may turn out to be a conservative lower bound on future sea level change. After all, this projection is based on the assumption that sea level changes similarly in the future as we have seen over the last 25 years. However, sea level may rise more rapidly in the coming decades, for example due to rapid changes in ice sheet dynamics.
Sources:
- Nerem et al., 2018. Proceedings of the National Academy of Sciences of the United States of America.
- Yi et al., 2017. Geophysical Research Letters 44: 11,905 - 11,913.


